
XAUUSD NFP Session Review, 6 November 2026: Payrolls Beat, a Sell-Side Sweep and a Reversal Into Supply
Timestamped session review, written after the move. October payrolls came in far stronger than expected, the dollar firmed and gold slipped about 1% on the day. The intraday path mattered more than the headline: the release spiked gold through sell-side liquidity, then reversed back into the same supply zone that had capped the morning. This review separates what the data said, what the chart did and what the pre-release read got right and wrong.
Executive summary
- Data: nonfarm payrolls +165,000 against a consensus near 65,000; unemployment 4.1% (4.2% expected); average hourly earnings +0.4% m/m and 3.1% y/y, both above forecast; August and September revised up by a combined 84,000.
- Macro read: a hawkish surprise. Stronger hiring and firmer wages strengthen the case for a December Fed hike, which lifted the dollar and Treasury yields and pressured gold.
- Price read: the first move after 16:30 EAT swept sell-side liquidity to about 4,027, then fully reversed into the 4,071–4,087 supply zone, which held for the second time in the day.
- Process lesson: the direction-by-zone read held (supply capped price twice); the timing did not. Positioning for a breakdown into a high-impact release exposed the plan to the release’s liquidity sweep.
- Into next week: the structure read stays bearish while price is below the 4,085–4,088 area. US CPI on Tuesday 10 November (16:30 EAT) is the next scheduled test.
1. Context: what the October jobs report said
| Measure | Actual | Expected / prior |
|---|---|---|
| Nonfarm payrolls | +165,000 | ~65,000 consensus (Dow Jones: 59,000) |
| Private payrolls | +159,000 | ~64,000 forecast |
| Unemployment rate | 4.1% | 4.2% expected and prior |
| Average hourly earnings | +0.4% m/m, 3.1% y/y | +0.3% m/m, 2.9% y/y |
| Revisions | September 29,000 → 60,000; August → 186,000 | +84,000 combined |
| U-6 underemployment | 7.9% | 7.6% prior |
The report was strong on every headline measure that matters for policy: hiring, unemployment, wages and revisions. Professional and business services led with about 70,000 jobs, followed by health care and manufacturing. The one softer detail was the rise in broad underemployment (U-6) to 7.9%, which suggests some slack is building beneath the headline.
Why it matters for gold
Gold pays no yield, so it competes with the return on cash and bonds. A report that raises the odds of another Fed hike lifts Treasury yields and the dollar together, and that combination is a headwind for gold. That is the textbook reaction, and it is broadly what happened on the day: the dollar and yields rose after the release, and spot gold traded near $4,050 late in the session, roughly 1% lower, after trading as high as about $4,106 before the data. Market commentary after the report described a December hike as the base case.
Two points keep the picture from being one-sided. First, U-6 underemployment rose, so the labour market is not uniformly tight. Second, the structural bid underneath gold is official-sector buying, which USAGOLD reported reached a 2026 monthly high in the latest data; that buyer does not trade the payrolls print. A single strong report reprices the next few weeks; it does not by itself change the medium-term story.
2. Structure: the read 30 minutes before the release
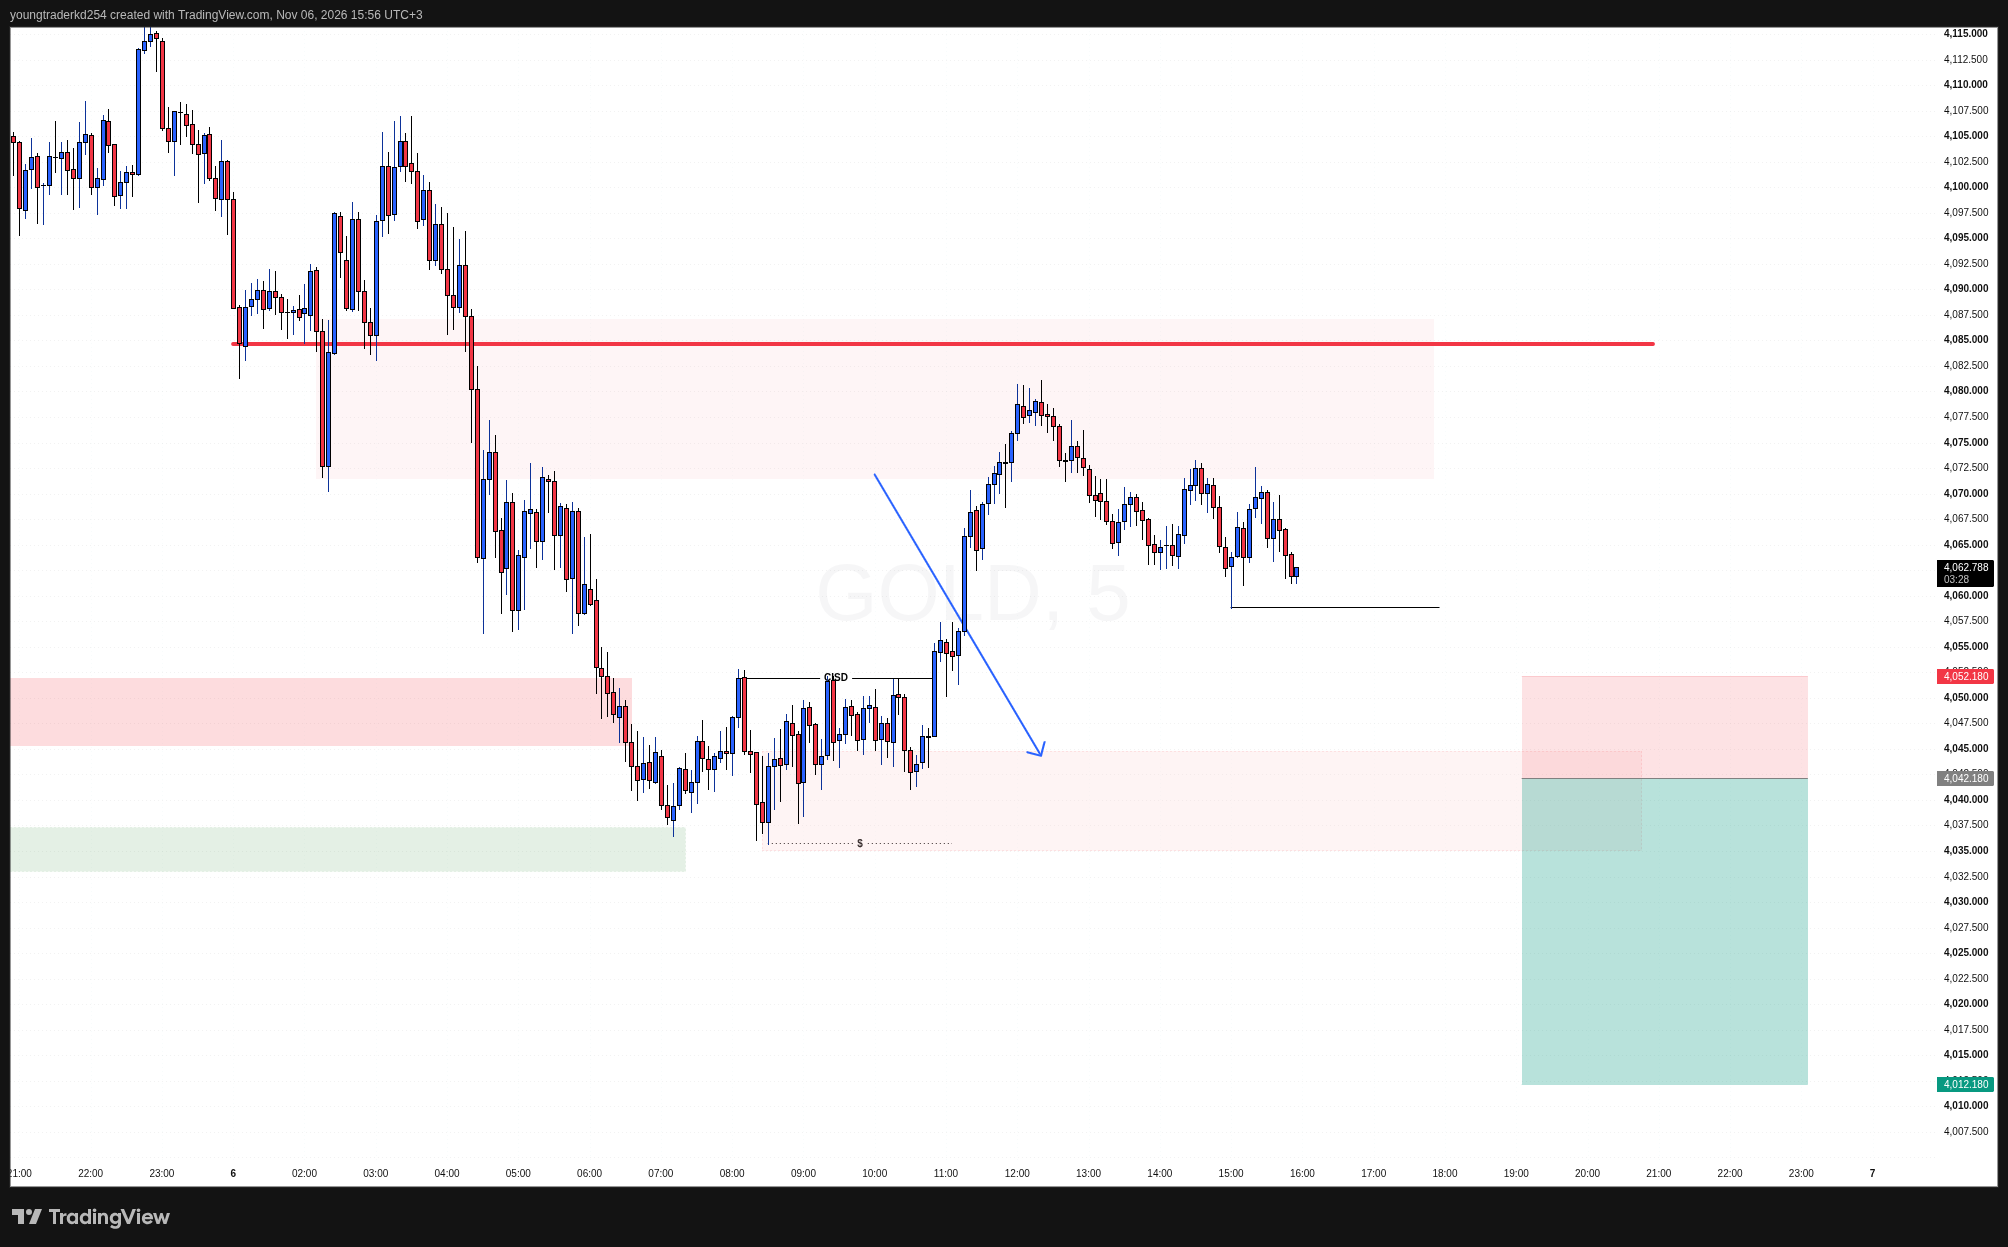
At 15:56 EAT on M5, the morning rally from the Asian lows had stalled inside the 4,071–4,087 supply zone (session high near 4,080), and price was compressing just above a range low near 4,058. Below that sat a discount zone of roughly 4,035–4,045, with resting sell-side liquidity just under 4,036 from the 08:30–09:00 lows, and an earlier change in state of delivery (CISD) near 4,052.
The pre-release read was bearish: supply had rejected price, and a break of the 4,058 range low was expected to continue lower after the data, through the discount zone and the liquidity beneath it.
3. Liquidity: what the release actually did
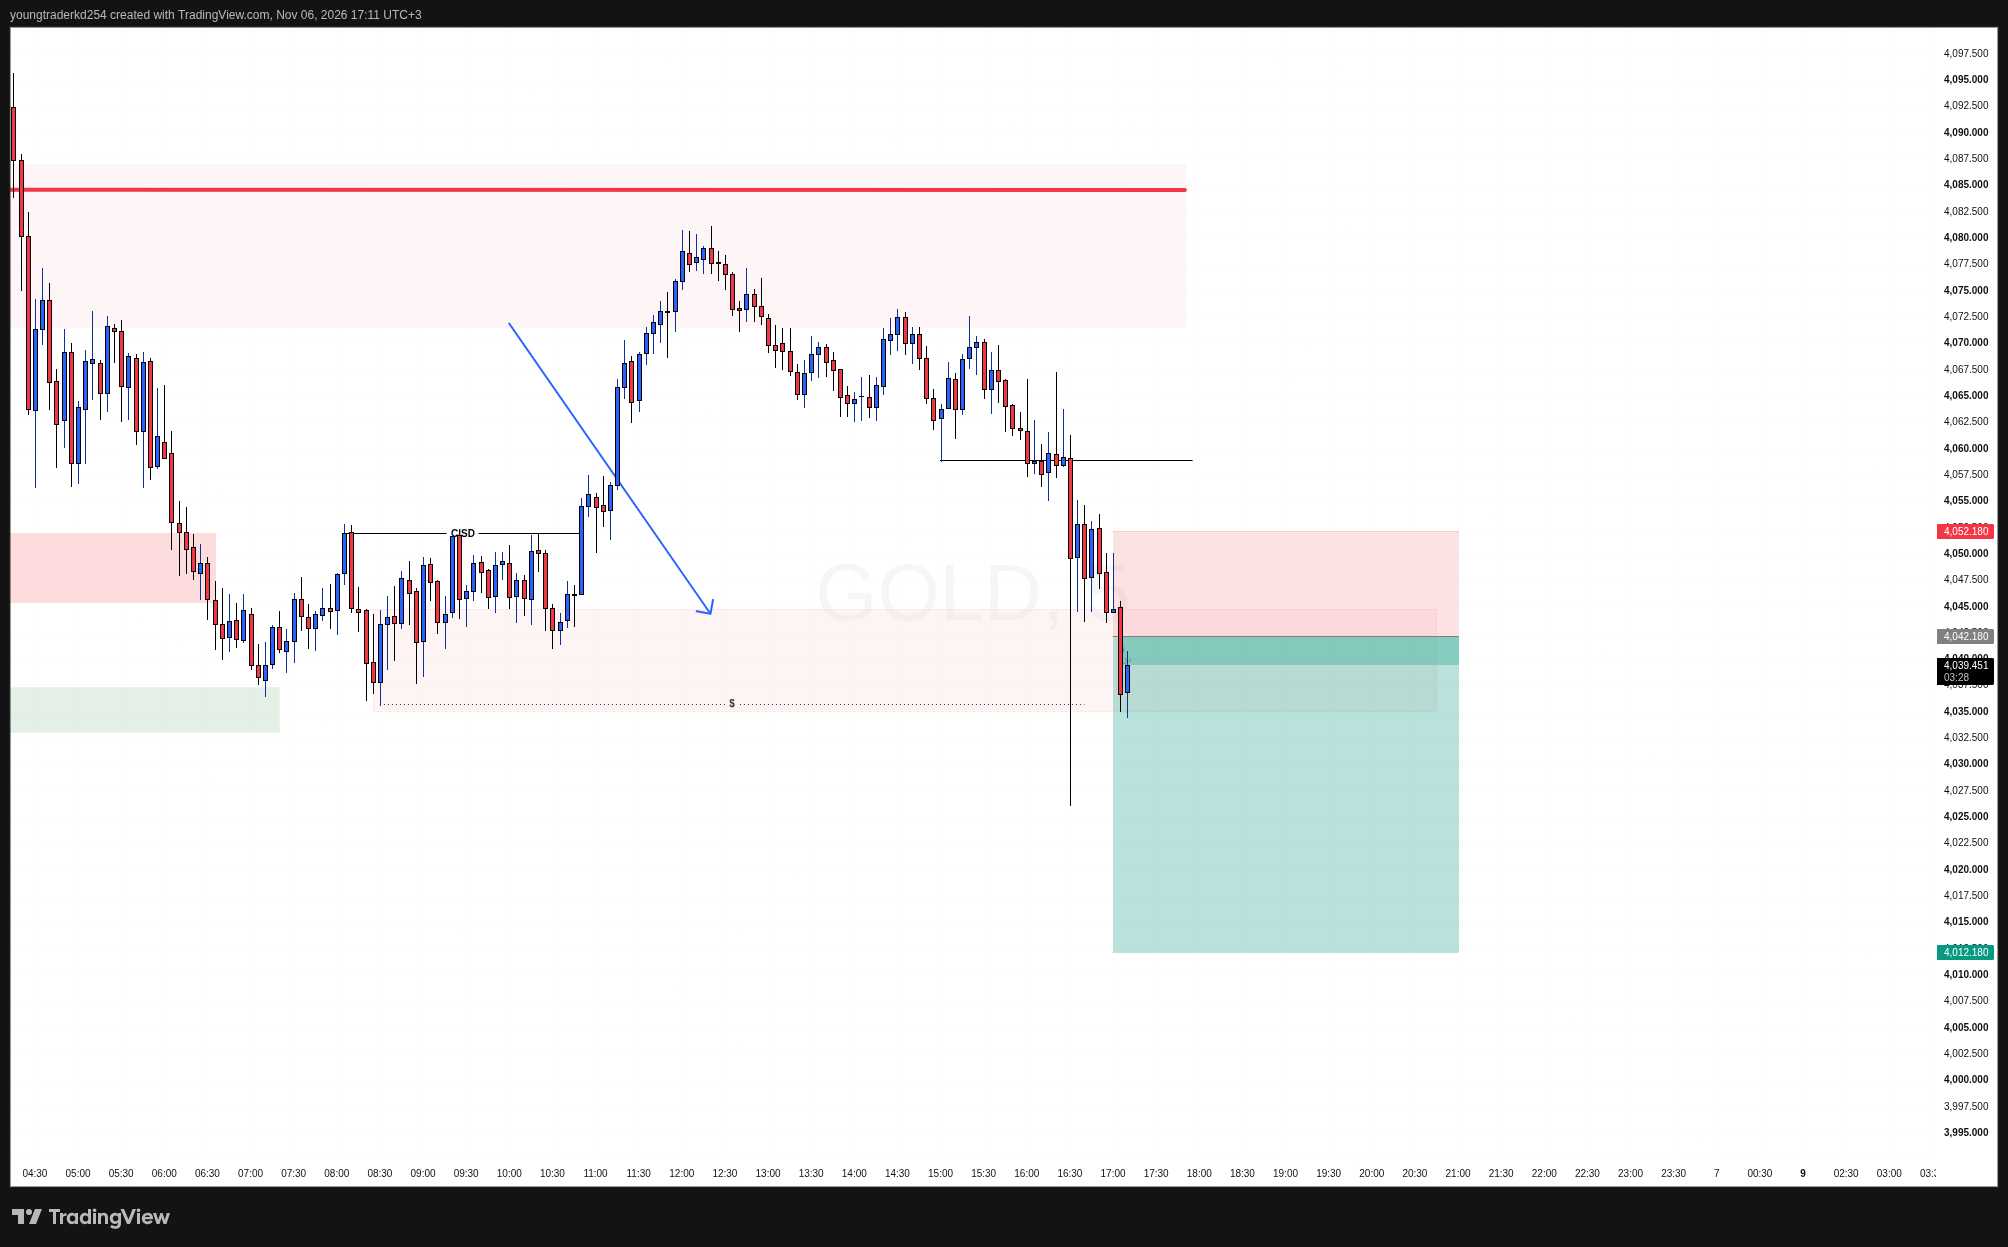
The 16:30 candle broke the 4,058 range low and spiked to about 4,027, cleanly through the sell-side liquidity under 4,036. That is the part of the read that worked. What followed is the part that matters: the spike low was not accepted. By 17:11 price had already recovered to about 4,039, back inside the discount zone, with a long lower wick marking the sweep.
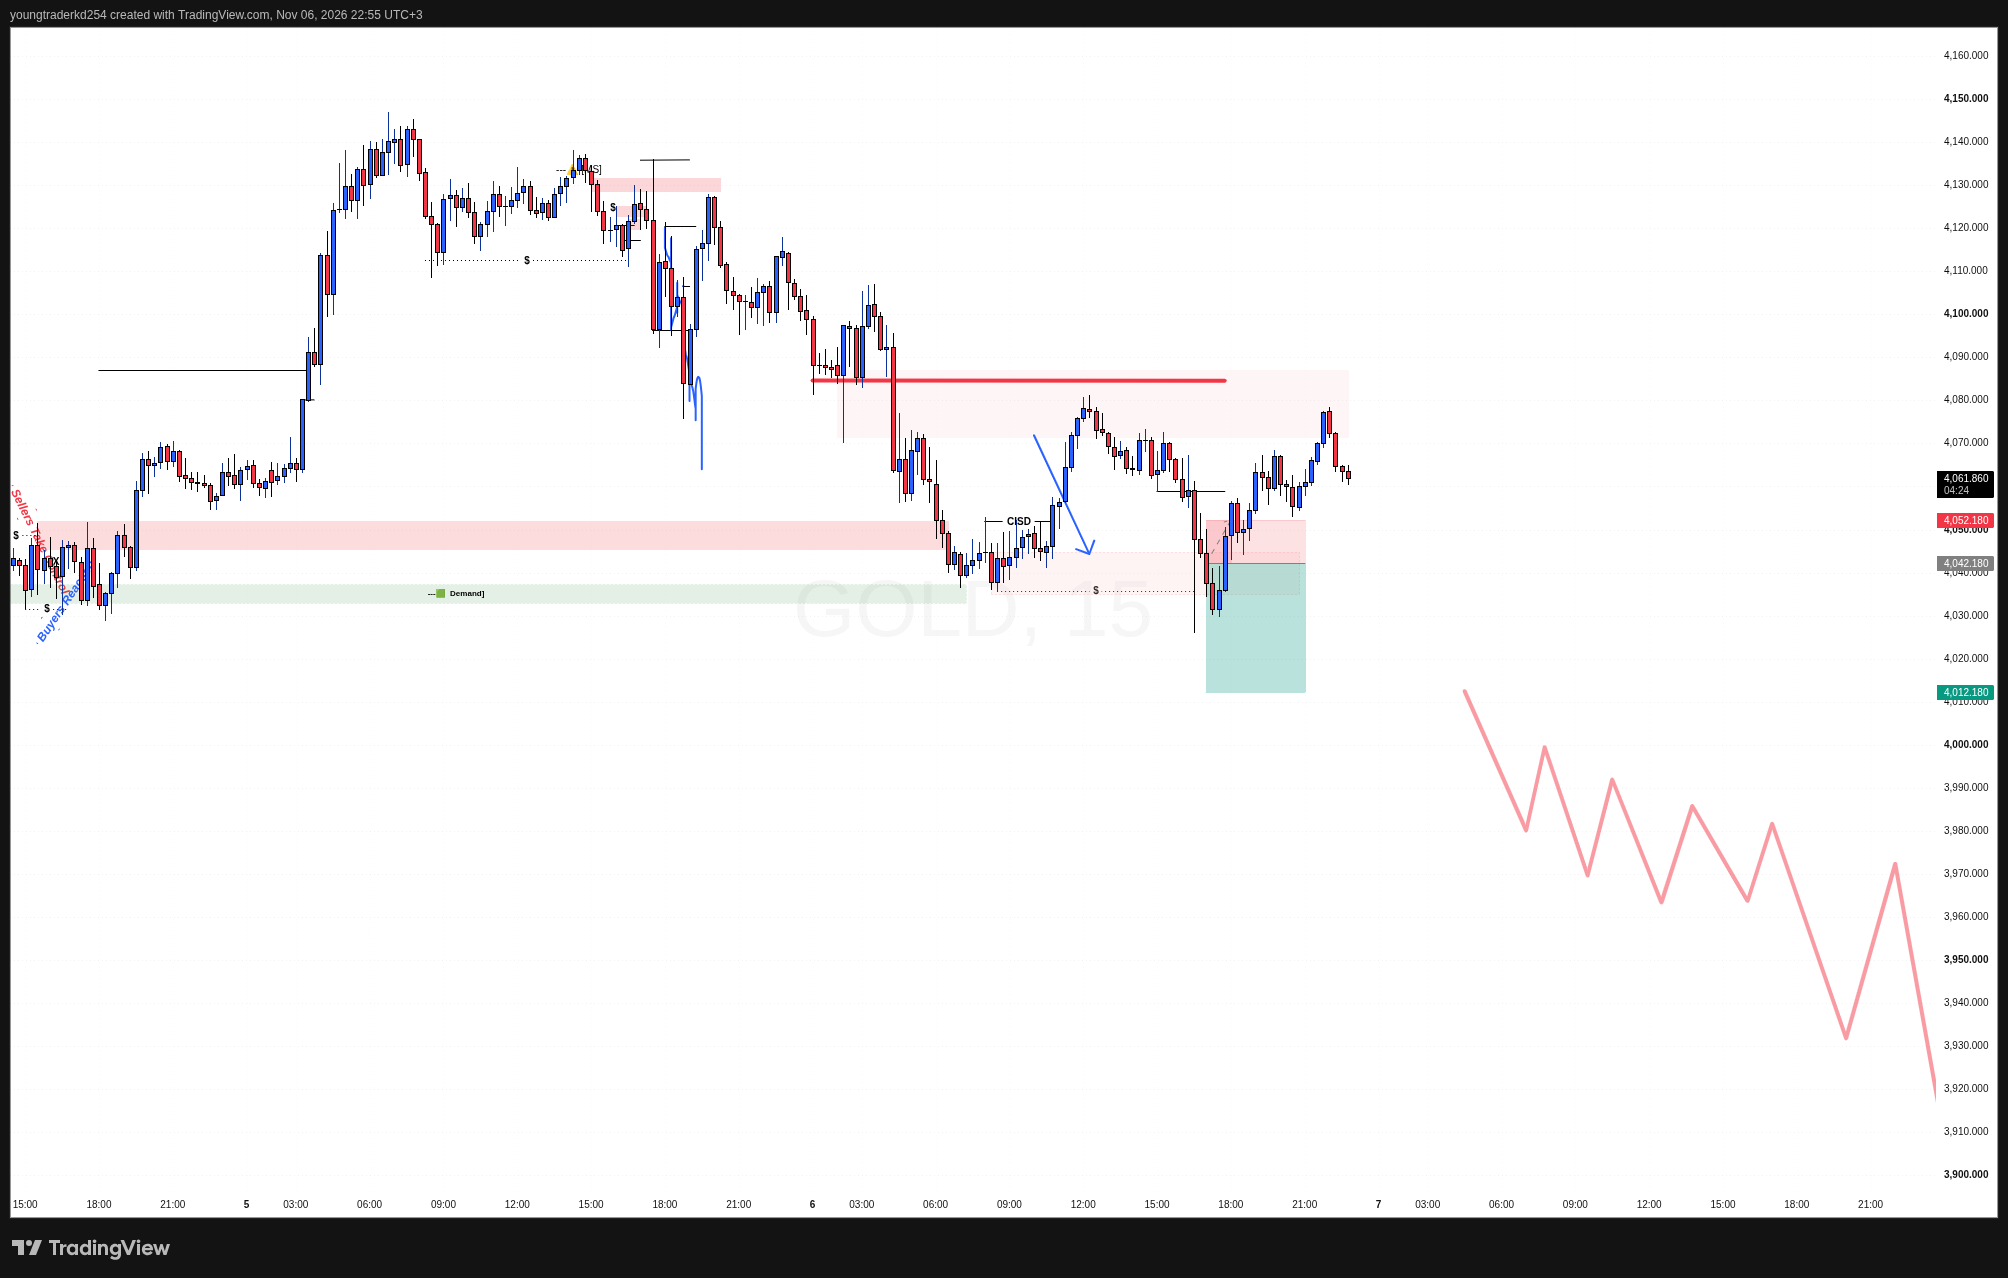
Through the New York afternoon, price reclaimed 4,052 and rallied back into supply, reaching about 4,078 around 22:00 EAT before rejecting again. At 22:55 it was trading near 4,062. On M15 the day therefore printed two rejections from the same 4,071–4,087 zone, one before the release and one after it, with a liquidity sweep in between.
4. Review: what the plan got right and wrong
- Right: the zone. Supply at 4,071–4,087 was correctly identified and held twice. The sell-side liquidity below 4,036 was correctly identified and was taken.
- Wrong: the timing and the trigger. A breakdown read placed into a high-impact release relies on the first move continuing. On NFP the first move is often a liquidity event, not a trend, and this one reversed within the hour.
- Volatility mismatch: the release range (roughly 4,027 to 4,078) was several times the width of the zones used to frame the read. Any plan that sits inside that range during the release is a bet on the first spike’s direction.
“Don’t sell the breakdown into the release. Sell the retest of supply after it.”
Paul Ngugi (KD), post-session review, 6 Nov 2026
The Strategist Analyst’s process note: on scheduled high-impact data, the cleaner read usually comes after the release, once the first liquidity sweep has happened and price returns to a known zone. Today that zone was the same supply that framed the morning.
5. Scenarios into next week
These are planning scenarios for study, not forecasts or trade instructions.
- Base case (bearish structure): while price stays below the 4,085–4,088 area, the intraday structure remains bearish. Acceptance back below the 4,027 sweep low would bring the 4,000 round number and then the 3,870 October low area into view. The chart’s projected path of lower highs is a scenario sketch, not a target.
- Alternative (bullish repair): sustained acceptance above 4,088 would mean supply has failed after three tests. That would shift attention back to the higher supply around 4,105–4,142 noted in the 5 November H4 outlook, and to buy-side liquidity above it.
- Range: if neither side is accepted, 4,027–4,087 is the box to respect until a catalyst resolves it.
Catalysts to watch
- US CPI (October data): Tuesday 10 November, 16:30 EAT. September CPI was 3.7% y/y. A firm print would reinforce the hike case; a soft one would be the first real counterweight to today’s report.
- Next jobs report: Friday 4 December, five days before the Fed’s final 2026 decision on 9 December.
6. Invalidation
The bearish structure read is invalidated by acceptance above the 4,085–4,088 area on M15 or H4, meaning closes above it that hold, not a single wick. A soft CPI print that pushes back December hike pricing would be the most likely macro trigger for that.
Sources
- U.S. Bureau of Labor Statistics, The Employment Situation, October 2026 (6 Nov 2026)
- CNBC, U.S. economy added 165,000 jobs in October (6 Nov 2026)
- Benzinga, October payrolls smash estimates at 165K (6 Nov 2026)
- FXStreet, Gold dives below $4,100 as blowout NFP underpins Fed hike odds (6 Nov 2026)
- USAGOLD, daily precious metals market report (6 Nov 2026)
- SimianX, US CPI release schedule (CPI date and September reading)
Follow the research desk on Telegram. Session reviews, structure notes and new research from The Strategist Analyst are posted on the channel first. Education only, no signals.
Charts: TradingView, XAUUSD M5 and M15, 6 November 2026, author’s own markup. Price figures in the text are approximate chart readings.
Risk warning. Trading foreign exchange and gold on margin carries a high level of risk and may not be suitable for everyone. You can lose more than you invest. Content on this site is educational analysis only. It is not investment advice, a recommendation or a trade signal. Use only brokers licensed by the Capital Markets Authority (CMA) of Kenya, and consult a licensed financial adviser before making investment decisions. Read the full disclaimer.
Related: Trading methodology · Market analysis · Disclaimer