
XAUUSD Session Review, 4 November 2026: Asia Liquidity Sweep, Minor BOS and the Midterm Repricing
Market analysis · XAUUSD · 4 November 2026 · Session review
Educational analysis only. Not investment advice or a trade signal. This is a review written after the session; all times are UTC+3.
Summary. During the Asian session on 4 November, gold went through a familiar sequence. It built a range, swept the liquidity below it, confirmed a shift with a minor break of structure, then returned to the order block that caused the break. Later in the morning, US midterm results weakened the dollar, and price expanded through overhead supply and above $4,000. This review records what the structure showed, and when, so the reasoning can be checked against what followed.
1. Context
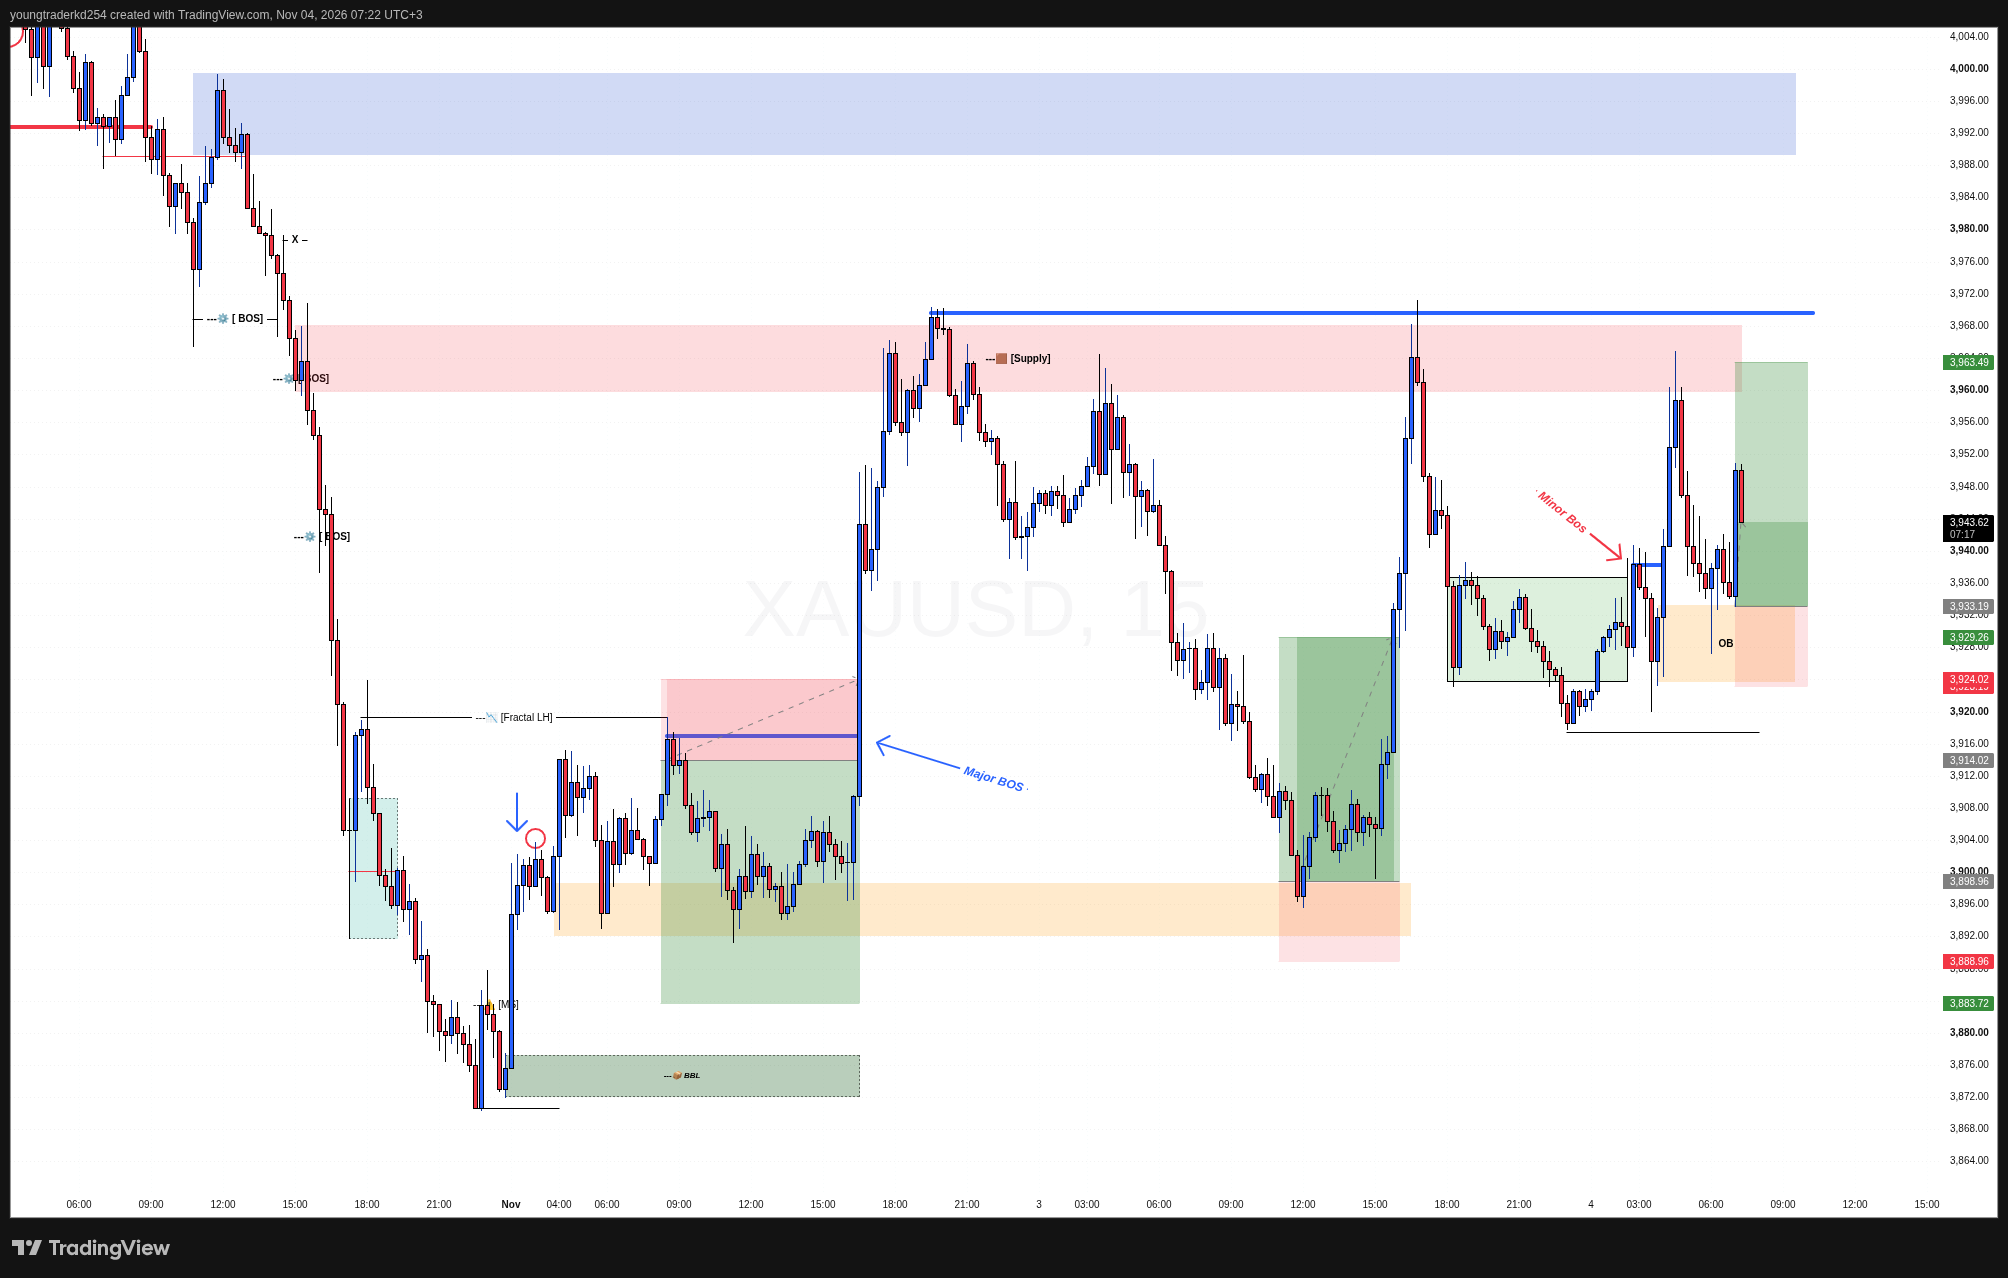
Instrument: XAUUSD. Timeframes: M15 for structure, M5 for the Asian-session detail. Coming into the week, gold had sold off into a low near 3,870 between 30 October and 1 November. The question for this session was whether the recovery from that low could hold.
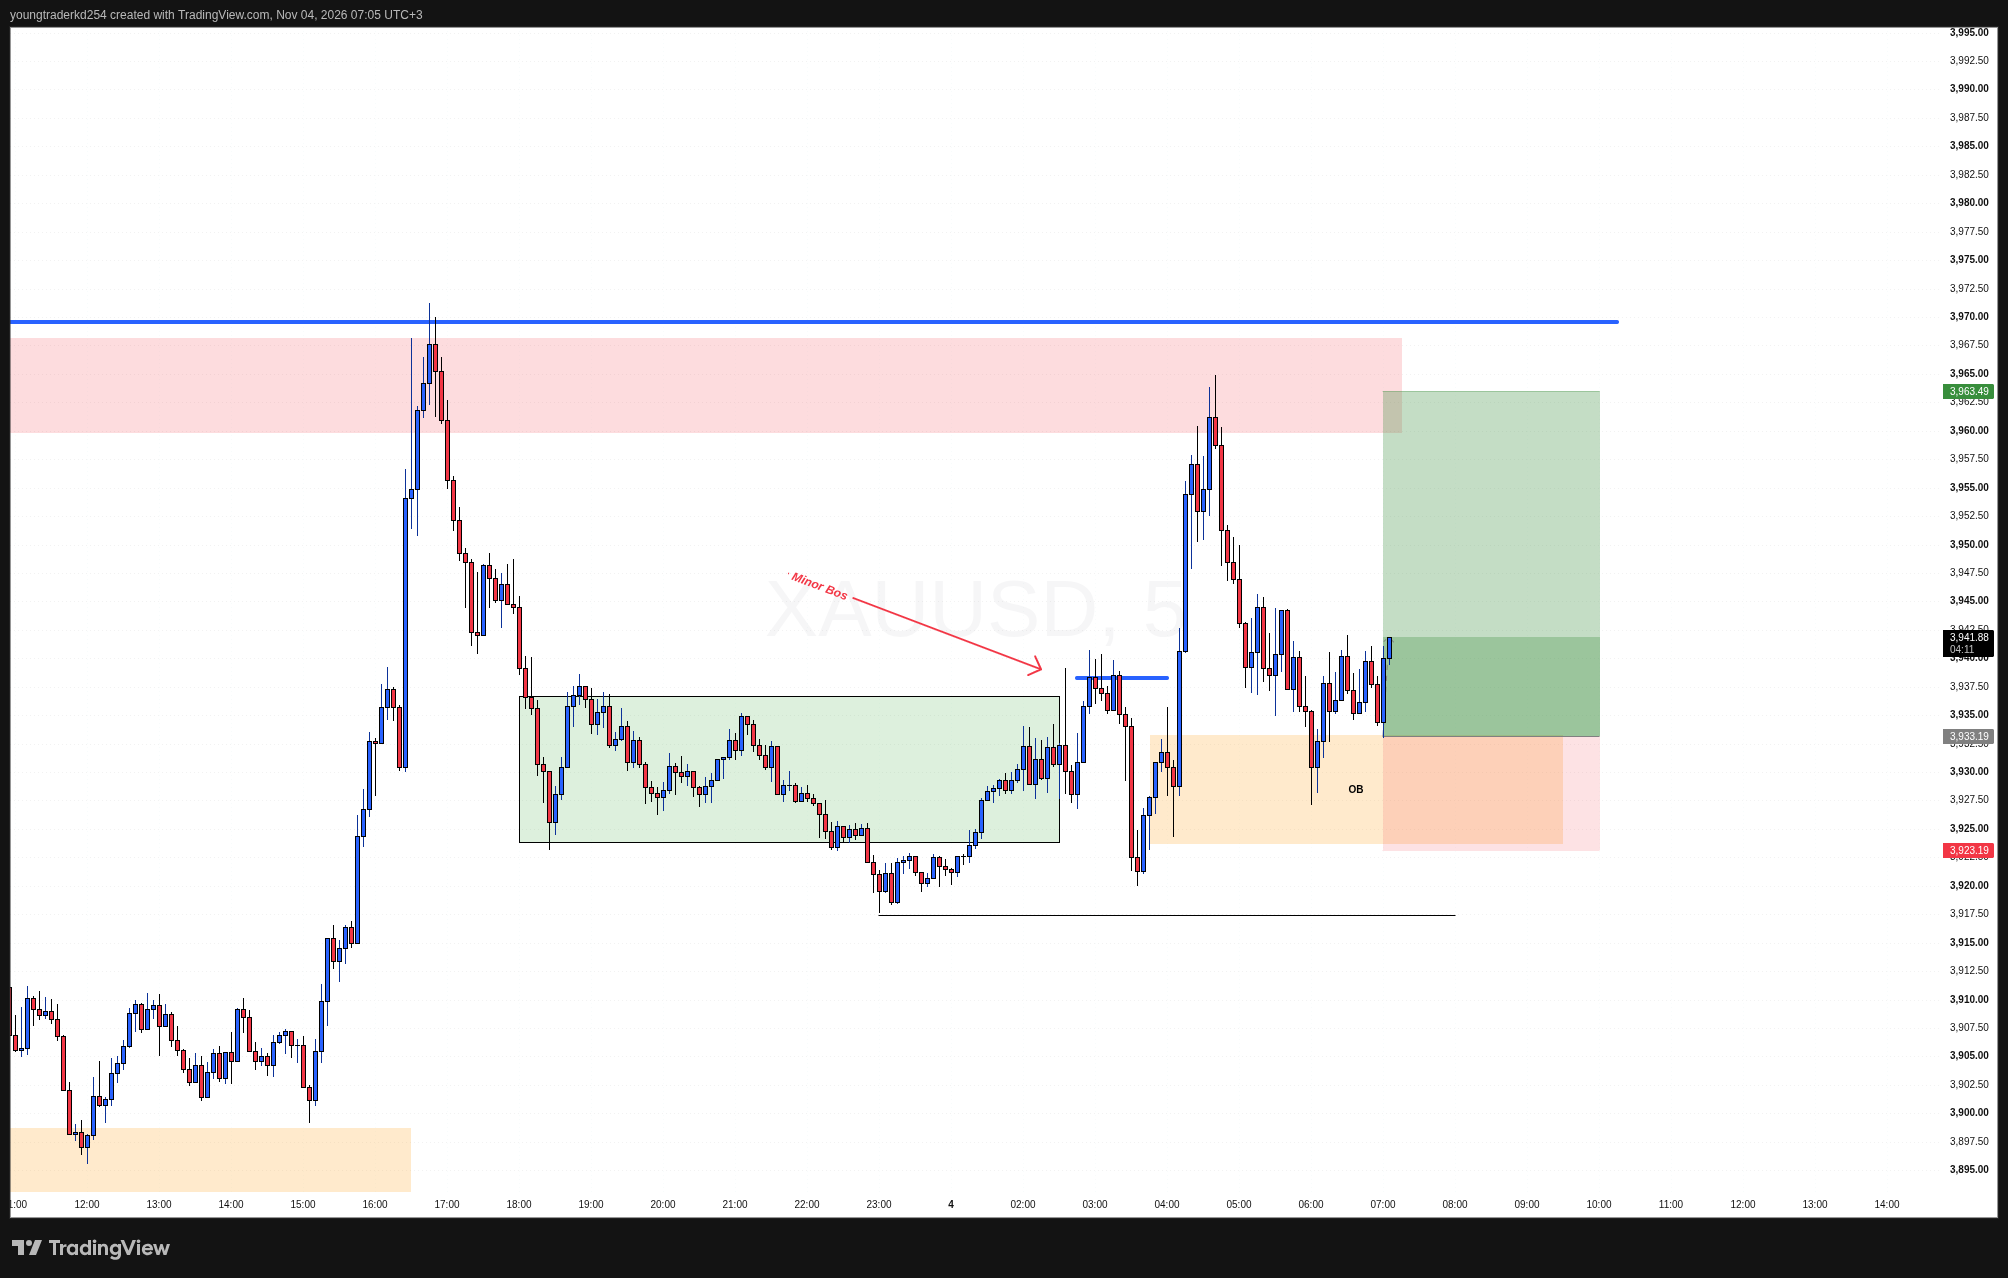
[M5 and M15, 1–4 November, structure and zones. ]
2. Market structure
- Major break of structure (1 November). The decline ended with a break above the last fractal lower high near 3,914. That was the first sign the sell-off had lost control.
- Dealing range. Since then, price has traded between a demand zone near 3,893–3,900 and a supply zone at 3,960–3,968. Demand held on its retest on 3 November. Supply rejected price twice, on 2 and 3 November.
3. Liquidity and zones of interest
- Buy-side liquidity. The two supply rejections left equal highs near 3,970. Equal highs are where stop orders typically rest, which makes them a draw on price.
- Sell-side liquidity. Overnight, price compressed in a range at roughly 3,924–3,936. Its lows formed the nearer pool of resting orders.
- Order block. After the sequence below, the last down-move before the break left an order block at roughly 3,924–3,933.
4. Scenarios
Bullish conditions
The bullish case needed three things in order. First, a sweep of the range lows that failed to hold. Second, a break back above the internal high. Third, a held retest of the order block that produced that break. All three occurred. Price swept to about 3,918, then broke above the internal high near 3,938 around 03:00. It returned to the order block between roughly 06:00 and 07:00 and held. A sweep alone is not a signal in this methodology; the break in the opposite direction is the confirmation.
Bearish conditions
The bearish case needed acceptance below the swept low near 3,918, meaning closes below it rather than a wick. That would have shifted attention to the 3,893–3,900 demand zone. A fresh rejection from the 3,960–3,968 supply zone would have kept the broader range intact.
5. Invalidation
The bullish read would have been wrong if price had accepted below the order block and the swept low near 3,918. That would have meant the sweep was a genuine move lower, not a liquidity grab.
6. Review
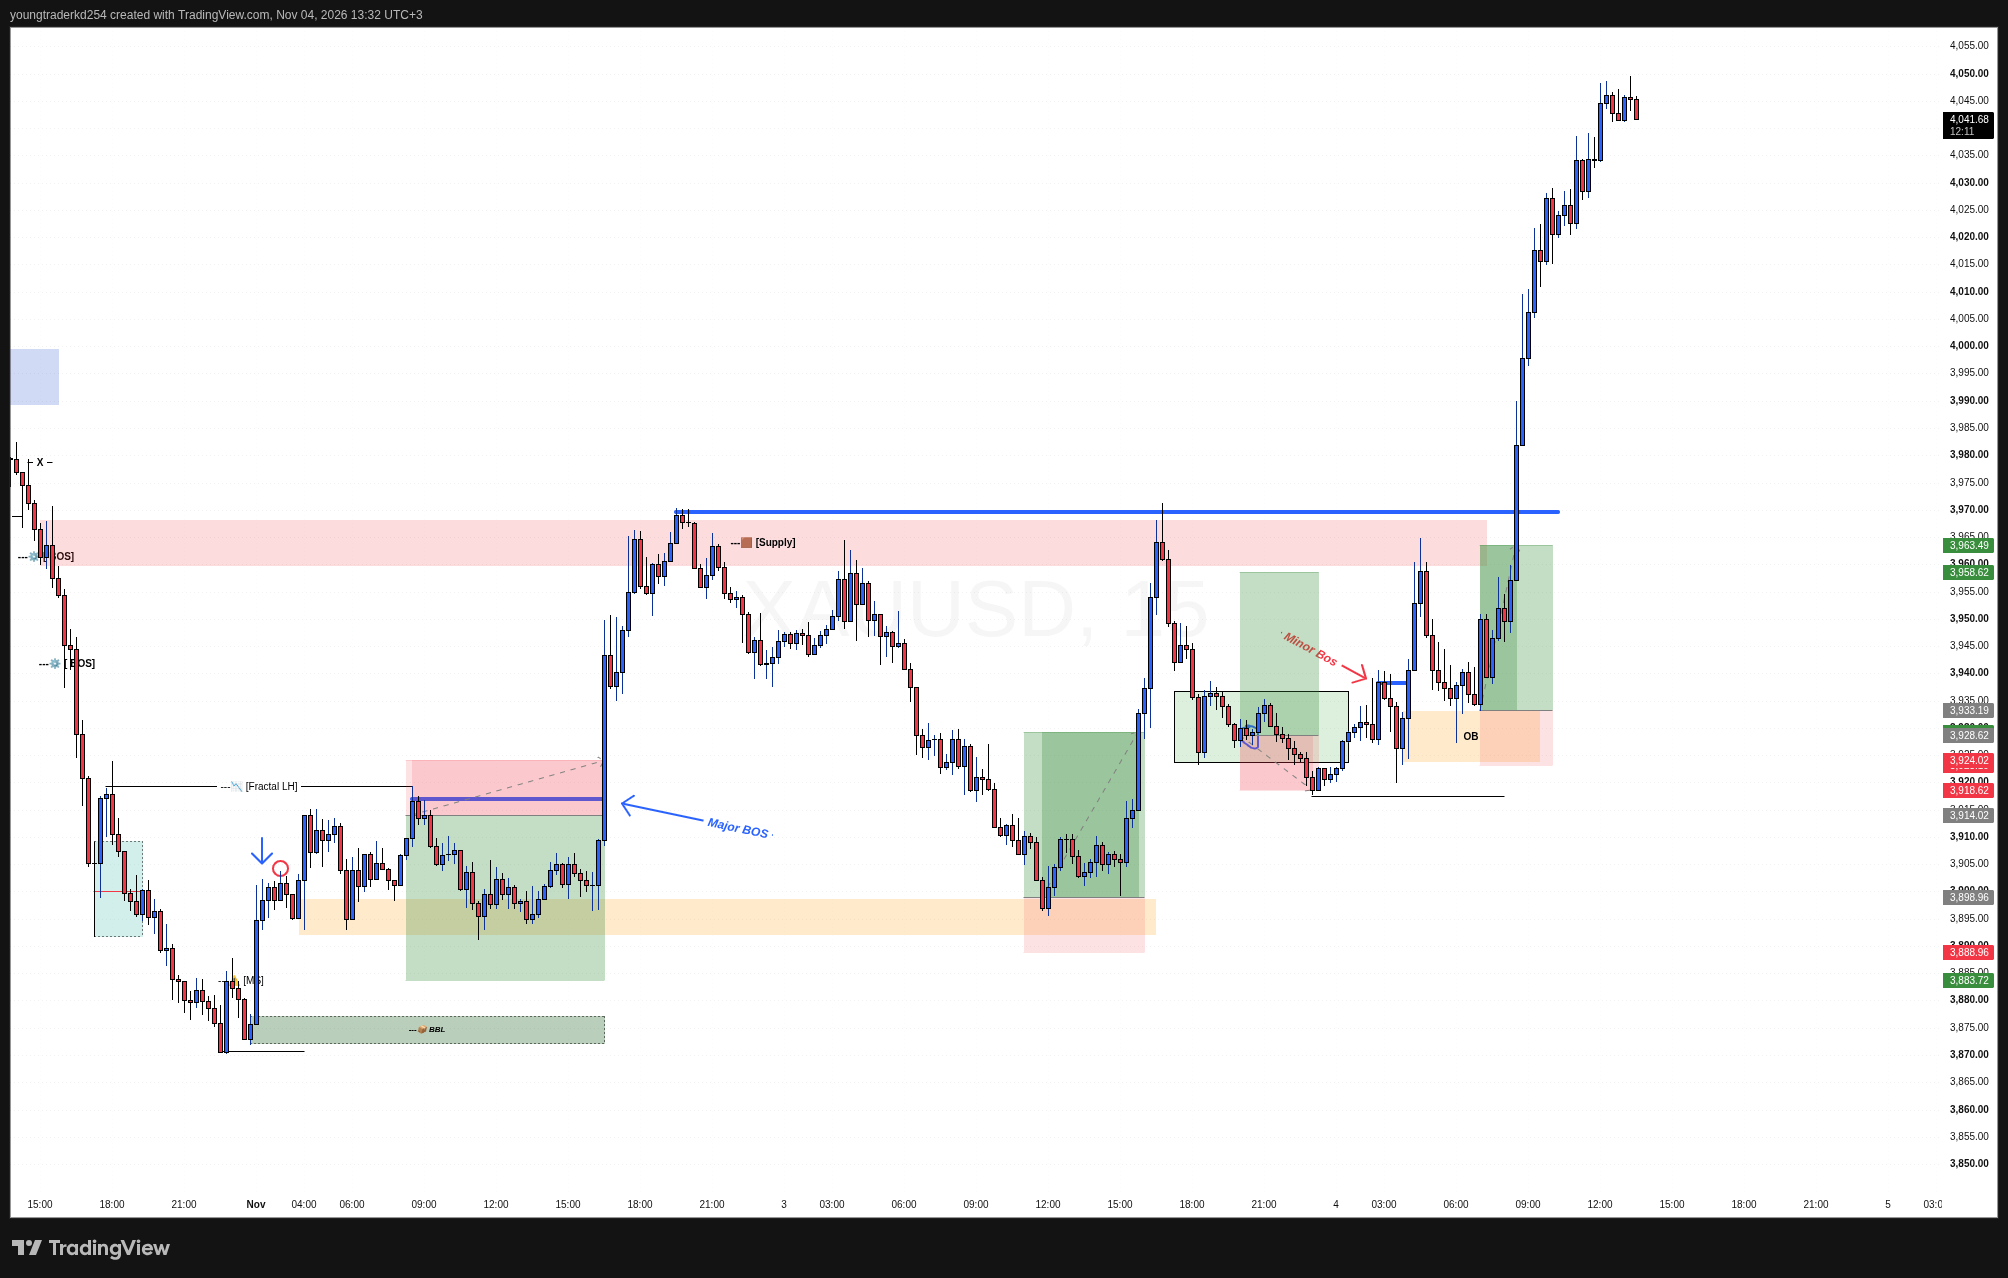
Price held the order block, then expanded through the 3,960–3,968 supply and the 3,970 equal highs. It traded above $4,000 and reached the mid-4,040s by early afternoon. CNBC reported that the jump came as projections pointed to Democratic control of the House. TradingKey attributed it to a weaker dollar and lower Treasury yields. Lower yields reduce the opportunity cost of holding gold, which pays no interest.
Lessons for the method:
- Structure set up before the news. The sweep, the break and the retest all happened before the results drove the move. The catalyst supplied momentum. It did not create the setup.
- Liquidity is a map, not a forecast. The 3,970 equal highs were an obvious draw on price. Being obvious did not make it certain they would be taken today.
- Event risk cuts both ways. A results-driven repricing could have run through the same zone in the other direction. Position size and invalidation matter most when a scheduled event sits inside the session.
- What to watch next. After an extension this large, the breakout area around 3,960–3,970 is the first structure to watch on any pullback. The forward view into Friday’s payrolls, including the December Fed-hike pricing that counterweights today’s move, is in the XAUUSD Outlook, 4–6 November 2026.
Follow the research desk on Telegram. Session reviews, structure notes and new research from The Strategist Analyst are posted on the channel first. Education only, no signals.
Sources: CNBC, 4 November 2026 · TradingKey, 4 November 2026
Risk warning. Trading foreign exchange and gold on margin carries a high level of risk and may not be suitable for everyone. You can lose more than you invest. Content on this site is educational analysis only. It is not investment advice, a recommendation or a trade signal. Use only brokers licensed by the Capital Markets Authority (CMA) of Kenya, and consult a licensed financial adviser before making investment decisions. Read the full disclaimer.
Related: Trading methodology · Market analysis · Disclaimer